
It seems like everything in trading is complicated and associated with charts, right? These traders say something like support, resistance or even they are going short. What does it all mean? Changelly has already explained the trading basics in the crypto trading glossary. Today, we are talking about two main factors in trading – support and resistance, forming a cryptocurrency price chart. Keep reading to find out more.
What Is Support in Terms of Crypto Trading
Why does the price almost always bounce off support? The line on the chart has a significant interpretation. Each buyer has a value at which he considers the asset to be underestimated. Each trader is looking for good entry points based on their experience. If the price rebounded from a certain level earlier, then this level has become acceptable for most buyers.
New players will perceive the support as a good entry point, and the price will rebound again. The concentration of orders at a certain level will increase the strength of support, preventing a possible collapse in prices below.
Source: dailyfx.com
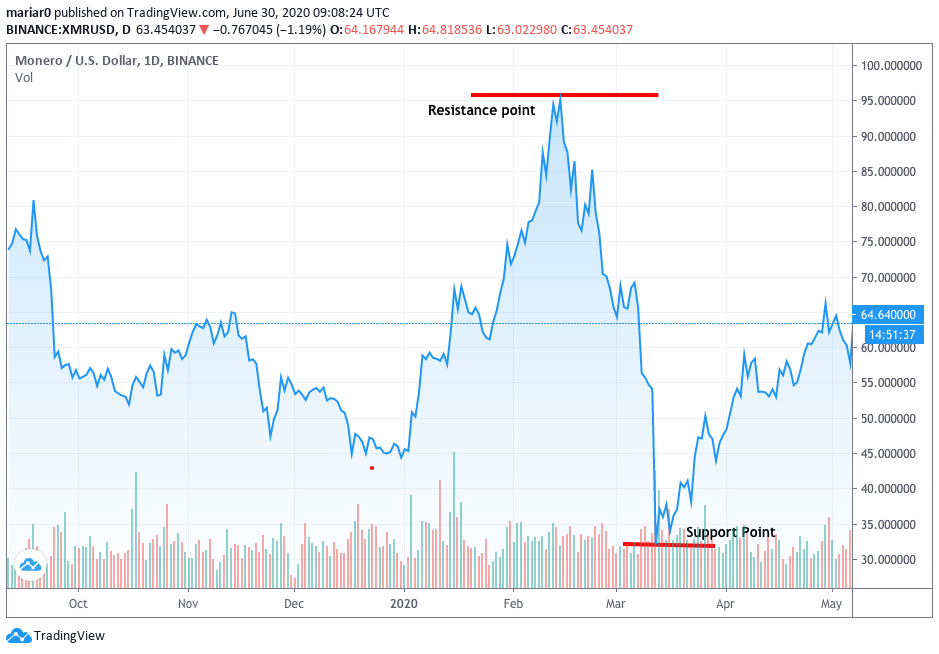
What Is Resistance in Terms of Crypto Trading
The maximum points on the chart form a serious psychological level of the ceiling. If an asset cannot break through the resistance for a sufficiently long time, then it is very dangerous to open long positions at this level.
As in the case of support, the pressure of sellers on a particular line creates a barrier through which price is hard to breakthrough. The more kickbacks from resistance, the stronger it is.
Horizontal Resistance and Support Levels
The main rule for determining key levels is that they are not just lines. On the chart, you can sometimes notice fake breakdowns of support or resistance. This is a good trap for bears and bulls. Inexperienced traders open a position on the first breakdown and immediately begin to lose money.
To avoid this, consider support or resistance as a specific area, not just a line. We also recommend finding key levels on a line chart that takes into account only the asset’s closing price. Technical indicators, which we have already talked about, will help determine the likely fake breakdowns.
For a price movement regarding support or resistance, its following rules are true:
- when the price goes through resistance, this level can turn into support;
- the more often the price tests a certain zone, the stronger the pressure of buyers/sellers is there;
- when support/resistance is broken, the strength of the subsequent price movement depends on the strength of the level;
- support/resistance strength depends on the time period. The lines on the daily chart are more reliable than the lines on the 1-hour chart.
Determining key support/resistance levels comes with experience. Do not forget that there are not only horizontal levels but also trendlines.
How to Determine the Trendline
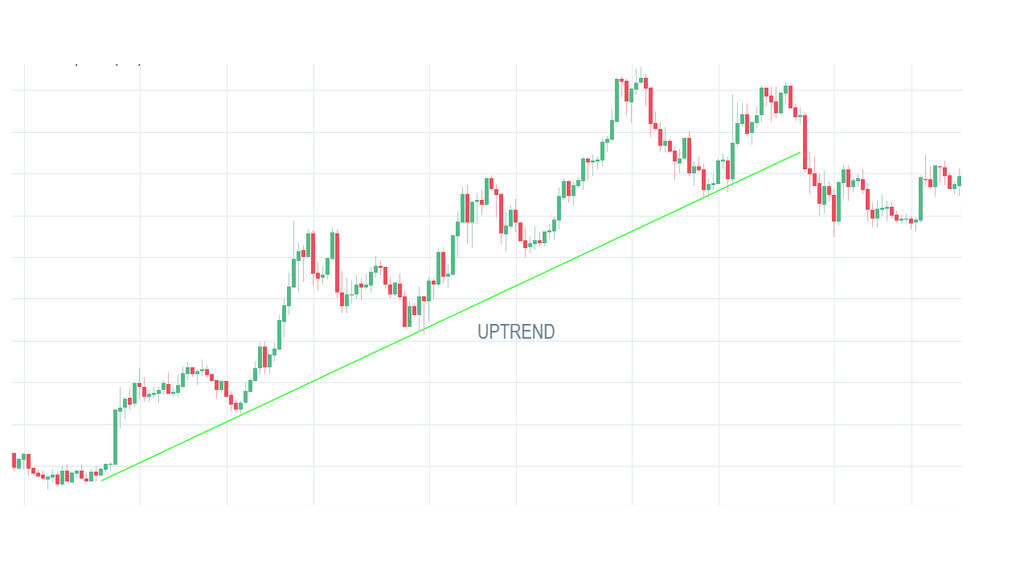
Unfortunately, some traders are not able to correctly determine the trend of an asset. To determine the inclined support/resistance line, it is enough to find the local min/max of the price.
In the case of growth, the trendline connects the lower points.
In case of a fall, the upper points.
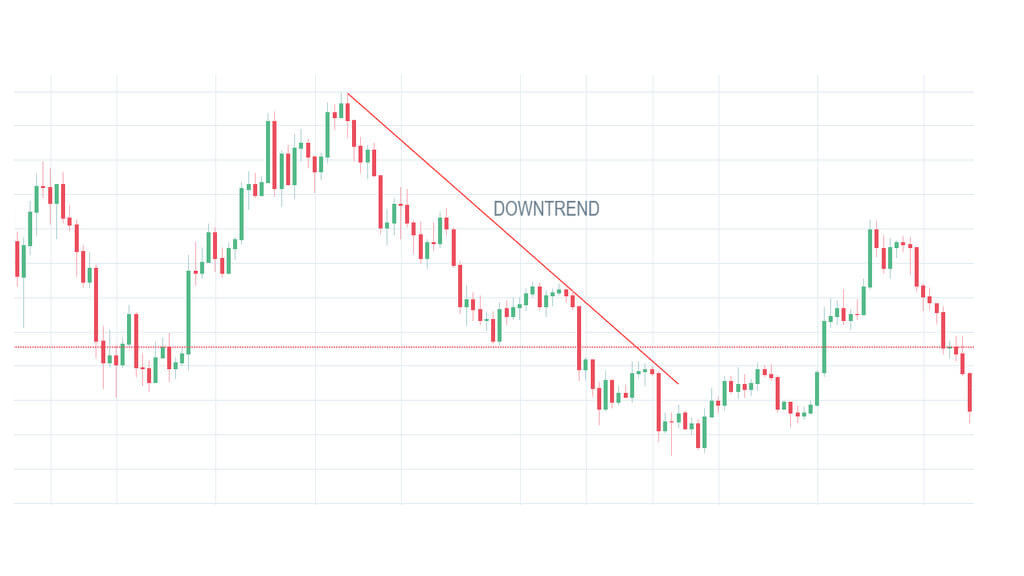
To build a trend line, find 2 points. However, only the trendline in contact with the price chart at three points can be considered valid.
The following characteristics characterize trendlines:
- the steeper the trendline angle, the less reliable it will be in the future;
- the more often the price comes into contact with the trend line, the stronger the price will jump/fall after it breaks through;
- the longer the trend line (on large time frames), the more reliable it is.
It is noteworthy that the price does not necessarily move up or down. After noticeable falls, the accumulation stage often begins, which is characterized by lateral movement.
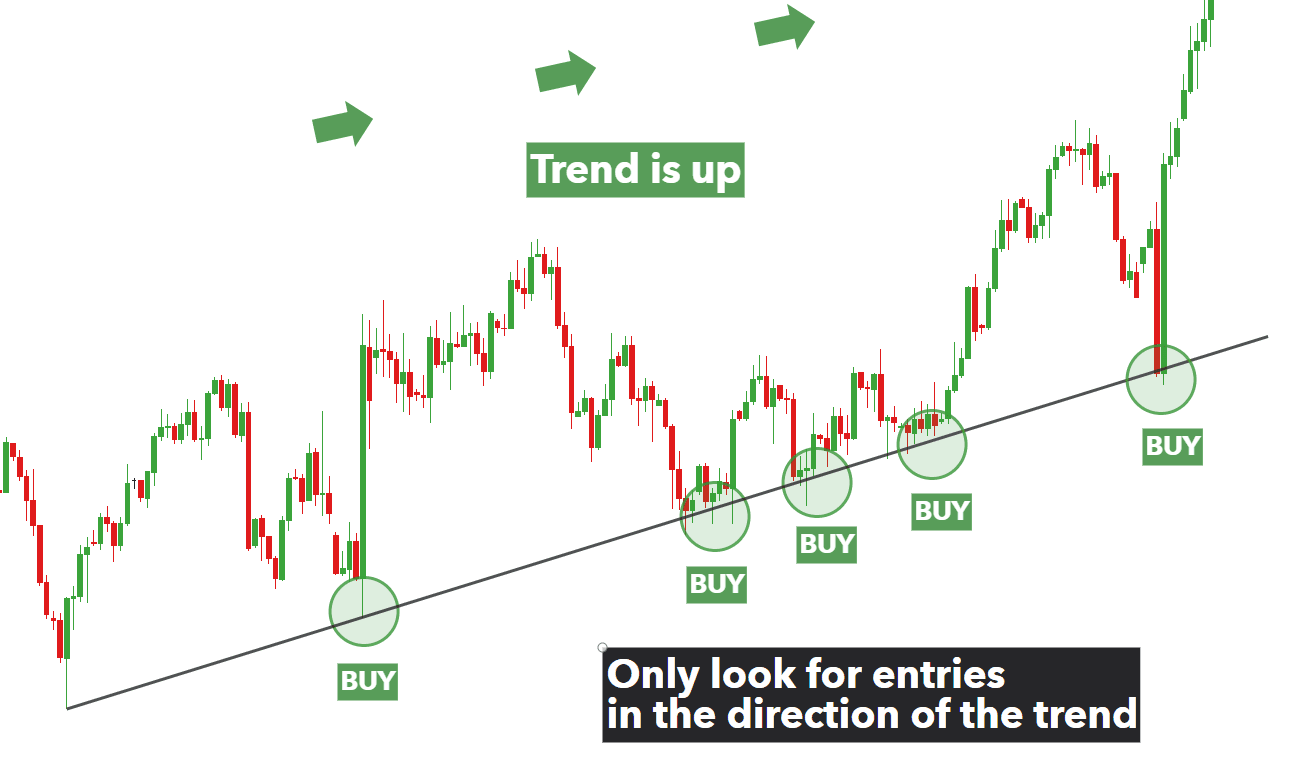
How to Use Support and Resistance
There are two simplest strategies for trading with trendlines – rebound and breakout.&
The first involves opening a long position after confirming a rebound from the support line. Why can’t you place an order in the support area itself? No one knows if the line will hold this drain wave. Although this way you can get more profit, most likely, such a strategy will result in the loss of the entire deposit.
If, after the rebound, the price still rushes down, stop loss will block losses from an unsuccessful transaction.
Trading a breakout is more difficult. Here you can already use two methods – aggressive and conservative. The first involves the opening of a short/long position immediately after breaking through support or resistance.
Why does this method sometimes fail? The fact is that after breaking through resistance and support, a price rollback very often happens, which again tests the line. Sometimes, such a rollback can become a fail, forcing the trader to close the negative position.
The conservative method involves opening a position after a rollback to the level of resistance/support. If the price has tested the line and bounces off it again, a trade transaction can bring good profit with minimal risk.
About Changelly
Changelly is a secure instant crypto exchange that has 150+ cryptocurrencies available to be swapped and bought at market-best rates. Operating since 2015, the platform and its mobile application attract over a million visitors monthly, who all enjoy quick and simple exchanges, low transparent fees, and 24/7 live support.
The post Support and Resistance in Trading appeared first on Changelly.
Comments